


Broadway Grosses w/e 7/15/2018: The Heat Is On.
Sidewalks and box offices all over the city are steamin’ as we roll into some of the biggest weeks of the year.
What I love about July is not just the higher grosses that shows post, but the consistency week over week of strong numbers.
We have better single weeks over the course of the year, but I don’t know another time in our business cycle that produces the string of solid numbers that July gives us.
What is it about July?
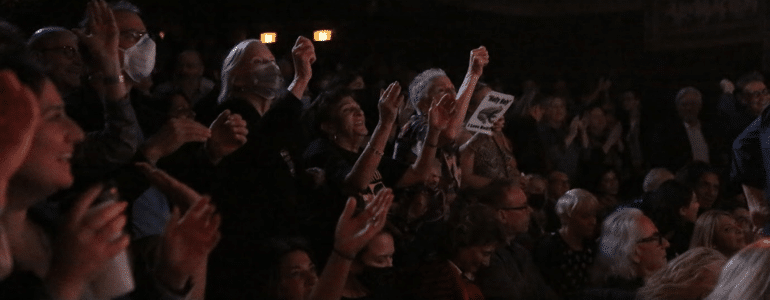
Tourists.
Just walk through Times Square and you can see why shows are doing what they’re doing.
But the real figure that’s amazing to me is that we’re already 15% up over last year’s record-grossing year.
While we’ll miss the big numbers of Angels in America (it closed on Sunday), all signs are pointing to Broadway continuing this incredible growth spurt it has been in for the last several years.
Here are the grosses from w/e 7/15/18.
| Show Name | GrossGross | TotalAttn | %Capacity | AvgPdAdm |
| A BRONX TALE THE MUSICAL | $582,997.75 | 6,896 | 82.57% | $84.54 |
| ALADDIN | $1,509,990.50 | 13,428 | 97.19% | $112.45 |
| ANASTASIA | $748,121.11 | 7,827 | 85.60% | $95.58 |
| ANGELS IN AMERICA | $1,273,539.50 | 9,882 | 99.28% | $128.87 |
| BEAUTIFUL | $737,856.76 | 7,326 | 89.25% | $100.72 |
| CAROUSEL | $866,092.00 | 9,086 | 79.53% | $95.32 |
| CHICAGO | $660,475.92 | 7,662 | 88.68% | $86.20 |
| COME FROM AWAY | $1,147,525.60 | 8,538 | 102.03% | $134.40 |
| DEAR EVAN HANSEN | $1,652,198.60 | 7,997 | 101.59% | $206.60 |
| FROZEN | $2,087,637.00 | 13,277 | 98.55% | $157.24 |
| HAMILTON | $3,109,924.00 | 10,756 | 101.78% | $289.13 |
| HARRY POTTER AND THE CURSED CHILD, PARTS ONE AND TWO | $2,211,269.00 | 12,976 | 100.00% | $170.41 |
| HEAD OVER HEELS | $306,926.25 | 6,132 | 80.85% | $50.05 |
| HELLO, DOLLY! | $974,225.08 | 10,966 | 94.80% | $88.84 |
| KINKY BOOTS | $679,248.15 | 7,565 | 66.41% | $89.79 |
| MEAN GIRLS | $1,557,871.05 | 9,899 | 101.01% | $157.38 |
| MY FAIR LADY | $1,332,037.00 | 8,413 | 98.37% | $158.33 |
| ONCE ON THIS ISLAND | $569,222.30 | 5,402 | 97.02% | $105.37 |
| SCHOOL OF ROCK | $929,422.20 | 10,150 | 83.31% | $91.57 |
| SPONGEBOB SQUAREPANTS | $910,545.00 | 11,699 | 90.83% | $77.83 |
| SPRINGSTEEN ON BROADWAY | $2,410,195.00 | 4,740 | 100.00% | $508.48 |
| STRAIGHT WHITE MEN | $350,130.00 | 4,381 | 94.26% | $79.92 |
| SUMMER | $814,285.50 | 7,775 | 66.11% | $104.73 |
| THE BAND’S VISIT | $1,068,646.56 | 8,312 | 100.00% | $128.57 |
| THE BOOK OF MORMON | $1,094,463.50 | 8,701 | 103.88% | $125.79 |
| THE BOYS IN THE BAND | $929,338.40 | 6,058 | 97.84% | $153.41 |
| THE LION KING | $2,721,986.00 | 15,145 | 99.22% | $179.73 |
| THE PHANTOM OF THE OPERA | $1,117,108.56 | 12,362 | 96.28% | $90.37 |
| THE PLAY THAT GOES WRONG | $341,040.00 | 5,243 | 76.74% | $65.05 |
| WAITRESS | $771,069.40 | 7,243 | 86.64% | $106.46 |
| WICKED | $1,864,640.00 | 14,626 | 97.95% | $127.49 |
| TOTAL | $37,330,027.69 | 280,463 | 92.18% | $133.89 |
| +/- THIS WEEK LAST SEASON | +5,407,768.37 | |||
| PERCENTAGE +/- THIS WEEK LAST SEASON | +16.94% |


Podcasting
Ken created one of the first Broadway podcasts, recording over 250 episodes over 7 years. It features interviews with A-listers in the theater about how they “made it”, including 2 Pulitzer Prize Winners, 7 Academy Award Winners and 76 Tony Award winners. Notable guests include Pasek & Paul, Kenny Leon, Lynn Ahrens and more.


