


Broadway Grosses w/e 4/21/2019: Broadway Shows are Bloomin’
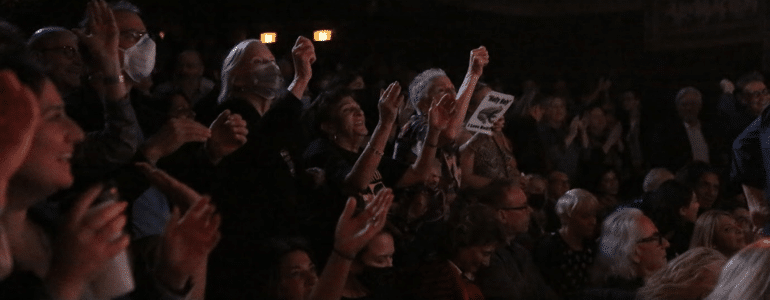
As tourists flocked to Broadway on their holidays and Spring breaks, theatres filled to the tune of $40M last week. Broadway mainstays, The Lion King, Wicked, Aladdin, and Frozen each added a 9th performance to capitalize on the tourist traffic.
The leaders of the pack for the season are To Kill A Mocking Bird, which broke another house record by pulling in $1.72M, and Ain’t Too Proud, which grossed nearly $1.4M. Most shows out of previews posted significant gains last week.
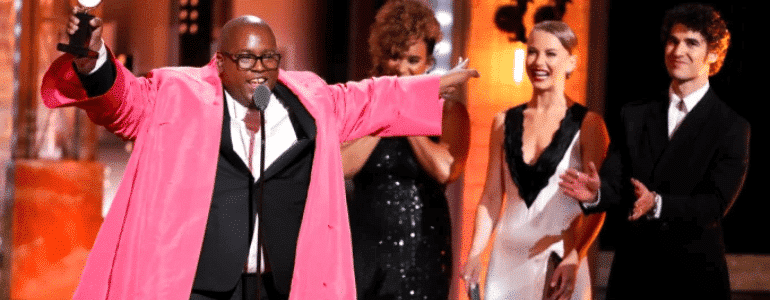
With the Tony Awards cut-off date set as April 25th, there are only a few more openings to mark the season. Expect to see bumps coming to those shows getting the most nominations next week.
You can find the rest of the figures below, courtesy of The Broadway League:
| Show Name | GrossGross | TotalAttn | %Capacity | Avg. Pd. Ad. |
| AIN’T TOO PROUD | $1,396,581.64 | 11,282 | 99.03% | $123.79 |
| ALADDIN | $2,048,492.00 | 15,537 | 99.96% | $131.85 |
| ALL MY SONS | $482,132.40 | 5,689 | 96.10% | $84.75 |
| BE MORE CHILL | $727,661.27 | 6,789 | 95.24% | $107.18 |
| BEAUTIFUL | $588,216.50 | 6,664 | 81.19% | $88.27 |
| BEETLEJUICE | $797,928.66 | 10,375 | 99.27% | $76.91 |
| BURN THIS | $768,765.75 | 7,509 | 97.77% | $102.38 |
| CHICAGO | $809,761.84 | 8,511 | 98.51% | $95.14 |
| COME FROM AWAY | $1,032,437.70 | 8,530 | 101.94% | $121.04 |
| DEAR EVAN HANSEN | $1,421,558.72 | 7,998 | 101.60% | $177.74 |
| FROZEN | $1,784,138.50 | 15,005 | 99.00% | $118.90 |
| GARY: A SEQUEL TO TITUS ANDRONICUS | $300,613.00 | 6,020 | 97.73% | $49.94 |
| HADESTOWN | $776,253.20 | 7,381 | 100.50% | $105.17 |
| HAMILTON | $3,299,435.00 | 10,749 | 101.71% | $306.95 |
| HARRY POTTER AND THE CURSED CHILD, PARTS ONE AND TWO | $2,021,090.50 | 12,976 | 100.00% | $155.76 |
| HILLARY AND CLINTON | $340,825.00 | 6,080 | 96.57% | $56.06 |
| INK | $316,263.30 | 4,671 | 91.66% | $67.71 |
| KING KONG | $986,113.48 | 12,112 | 87.11% | $81.42 |
| KING LEAR | $608,716.50 | 6,482 | 77.24% | $93.91 |
| KISS ME, KATE | $779,009.20 | 7,894 | 98.87% | $98.68 |
| MEAN GIRLS | $1,360,359.00 | 9,854 | 100.55% | $138.05 |
| MY FAIR LADY | $885,763.00 | 8,096 | 94.67% | $109.41 |
| NETWORK | $1,020,895.94 | 7,107 | 100.03% | $143.65 |
| OKLAHOMA! | $604,973.00 | 5,265 | 101.56% | $114.90 |
| PRETTY WOMAN: THE MUSICAL | $808,523.00 | 8,127 | 86.98% | $99.49 |
| THE BOOK OF MORMON | $1,123,519.60 | 8,688 | 103.72% | $129.32 |
| THE CHER SHOW | $790,985.50 | 8,566 | 77.59% | $92.34 |
| THE FERRYMAN | $517,930.92 | 5,534 | 67.89% | $93.59 |
| THE LION KING | $3,149,674.00 | 15,230 | 99.78% | $206.81 |
| THE PHANTOM OF THE OPERA | $1,444,820.58 | 12,389 | 96.49% | $116.62 |
| THE PROM | $659,804.00 | 7,546 | 90.26% | $87.44 |
| TO KILL A MOCKINGBIRD | $1,720,828.14 | 11,662 | 101.59% | $147.56 |
| TOOTSIE | $907,612.30 | 12,287 | 95.87% | $73.87 |
| WAITRESS | $842,417.10 | 8,062 | 96.44% | $104.49 |
| WHAT THE CONSTITUTION MEANS TO ME | $462,612.00 | 4,603 | 98.69% | $100.50 |
| WICKED | $2,633,078.00 | 16,930 | 97.67% | $155.53 |
| TOTALS | $40,219,790.24 | 328,200 | 95.30% | $115.47 |
| +/- THIS WEEK LAST SEASON | +$2,713,553.22 | |||
| % +/- THIS WEEK LAST SEASON | +7.23% |
Today’s blog was guest-written by Ryan Conway, General Manager for DTE Management. Find out more here!

Podcasting
Ken created one of the first Broadway podcasts, recording over 250 episodes over 7 years. It features interviews with A-listers in the theater about how they “made it”, including 2 Pulitzer Prize Winners, 7 Academy Award Winners and 76 Tony Award winners. Notable guests include Pasek & Paul, Kenny Leon, Lynn Ahrens and more.


